TorXviz Example
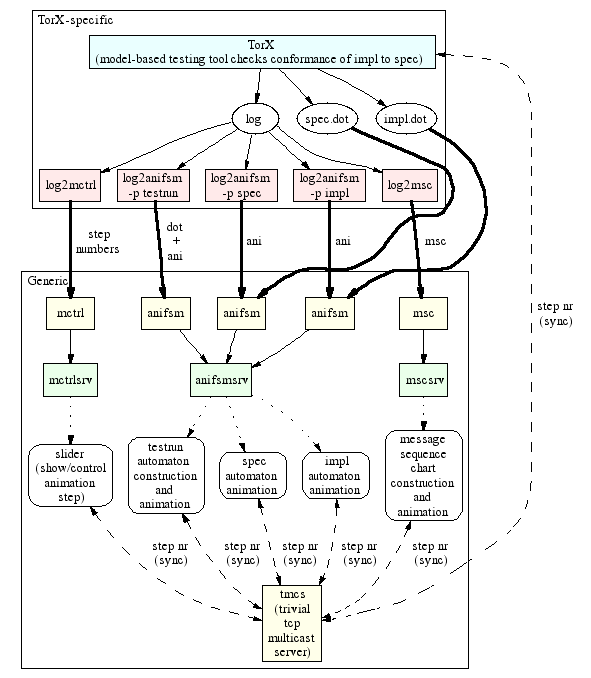
Here we show how the TorXviz tools are used in a typical test session with TorX.The following figure shows the TorXviz tools that are running in a typical session with TorX, and the data flow between them.
At the bottom, in the big box 'Generic' we see the generic
TorXviz programs that we discussed on the
TorXviz introduction page.
At the top, in the big box 'TorX-specific' we see torx-specific
programs that provide the visualization data for the generic
programs: TorX itself, and a number of utilities (small filters)
that translate data from torx-specific formats to the generic
formats that the TorXviz tools expect.
The 'fat' (bold) arrows represent the data in 'generic'
format that flows from the TorX-specific programs to
the generic TorXvis programs.
In the figure the normal boxes represent (running) programs, and ellipses represent files. The yellowish normal boxes are TorXviz client programs that are started directly by the user. The greenish normal boxes are TorXviz server programs that are started via the TorXviz client programs -- the user does not need to be aware of their existence. The blueish normal box reprents all non-visualization components of TorX. The reddish normal box represents the TorX-specific 'glue' programs that are needed to translate TorX-specific data into the 'generic' format expected by the TorXviz client programs.
The boxes with rounded rectangles represent the windows that the user sees. The normal arrows represent data that flows from one program to another over a reliable medium, usually a pipe or a tcp connection. The stippled arrows show which (server) programs create and control which windows.
The dashed arrows represent the synchronisation connection between the various visualization programs that allows them to simultaneously show (switch to) the same step in the visualization sequence.
When we study the figure more closely we see that
all windows are created (controlled) by server ('srv')
programs, and that all communication between a TorX-specific
program and a server program flows via a dedicated instance
of the client program for the particular server.
We also see that we use the same filter program (log2anifsm)
in three different ways to filter out different information
from the log.
In two cases (for 'spec' and 'impl') log2anifsm only derives
animation commands ('ani' in the figure)
that are used to color nodes and edges
of a graph given in a pre-generated dot file
('spec.dot' resp. 'impl.dot').
In the third case (for 'testrun') the graph is dynamically
created while test testing takes place, so there log2anifsm
derives also graph node and edge creation commands
('dot' in the figure, hence the 'dot + ani' arrow).

